This post continues the theme of discussing emerging trade set ups using the oscillator techniques outlined in the video I posted on 26th October
The Big Picture
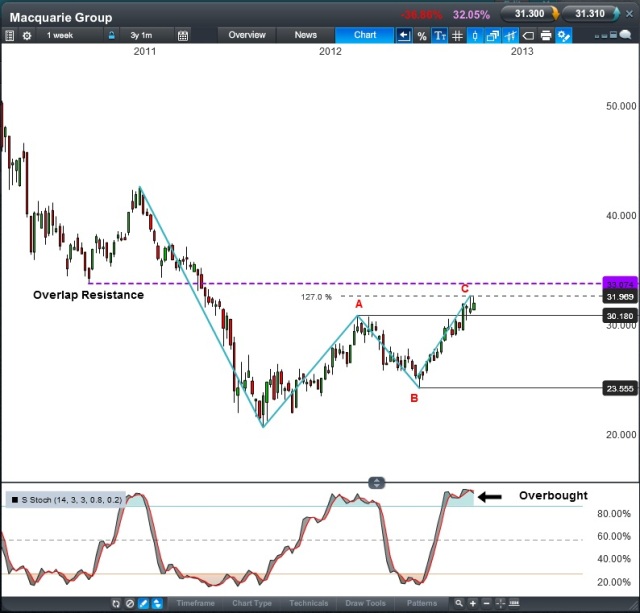
My key reads from the weekly chart are:
- As long as price stays below the dashed overlap resistance line, the rally from the October 2011 may be only a correction of the last major swing down.
- The rally off the 2011 low has so far taken a 3 swing or ABC structure. This is consistent with a corrective move
- The potential peak at “C” has parked at a Fibonacci projection level. This projects that the length of the B/C swing will be 127% of the of the A/B correction
- The slow stochastic is over bought, supporting short set ups in lower time frame charts (one of the techniques discussed in the oscillator video)
- Everything above points point to the potential for sell trades based on lower time frame charts if a good quality set up can be identified
The Set Up
This set up uses RSI divergence on the daily chart.
Price has recently formed a rising wedge formation (blue lines). The potential for this to be a reversal set up is supported by the RSI which is showing good divergence. Encouragingly, the first peak in the divergence set up was in the overbought zone.
Trade entry
Entry could be once the RSI moves below the dashed support line shown on the chart. A move below this level is known as a failure swing. Having made lower highs, the RSI breaches support and makes a lower low as well.
This is an example of the RSI’s potential as a confirmation tool. The failure swing on the RSI is confirming the potential significance of a break below the wedge support. Today’s candle, for example, did push a little below the wedge support without going on with it. The trader would so far be kept out of this situation because the RSI has not completed a failure swing.
A strategy approach
One way of handling this situation would be:
- Sell on a breach of the RSI support
- Place the initial stop just behind the peak at $31.99
- Adopt a let your profits run approach, given the big picture outlook that this may be the end of an upward correction in a major downtrend.
- Use the support zone represented by the 50% retracement level and 200 day moving average as an initial objective to either begin moving the stop down or to take partial profit
- Move the stop loss down as new failure points emerge in the down trend being followed


